

In this article you'll find everything you need to know about data-driven marketing for ecommerce. It's written and kept up to date by Mattia Chiaruttini, ecommerce marketing consultant since 2016. Read it to the end, and if you have questions, send me a message.
Most ecommerce brands don't have a data problem. They have a too-many-dashboards problem. Data-driven marketing for ecommerce means making budget, offer and creative decisions from a short list of numbers you trust, starting from real orders in your store, not from whatever each ad platform says about itself. Six numbers are enough. Below you'll find which ones, how to track them and what to do when they move.
It's the first thing I set up when I start as an ecommerce consultant, before touching a single campaign in Meta Ads and Google Ads.
In short
- Six numbers, not sixty: contribution margin per order, MER, new-customer CAC, AOV, repeat purchase rate and conversion rate by device.
- Your store is the source of truth: Meta and Google each count the same sale their own way. Shopify orders don't double count.
- Platform ROAS is for comparing ads, not for setting budget: use MER for the big decisions.
- Tracking before scaling: Conversions API, enhanced conversions, clean UTMs and a post-purchase survey.
- Numbers need rules: decide in advance what you'll do when each one goes up or down.
What does data-driven marketing actually mean for an ecommerce brand?
It doesn't mean more reports. It means every recurring decision (how much to spend, what to promote, which ad to keep) has a number behind it, and everyone agrees on where that number comes from.
The trap is letting each platform grade its own homework. Meta reports a ROAS, Google reports another, your email tool claims a share too, and if you add them up you'll often get more revenue than your store actually made. That's normal: each one measures with its own attribution rules. It's also why the big decisions belong to numbers that start from your store.
Which 6 numbers should an ecommerce brand track?
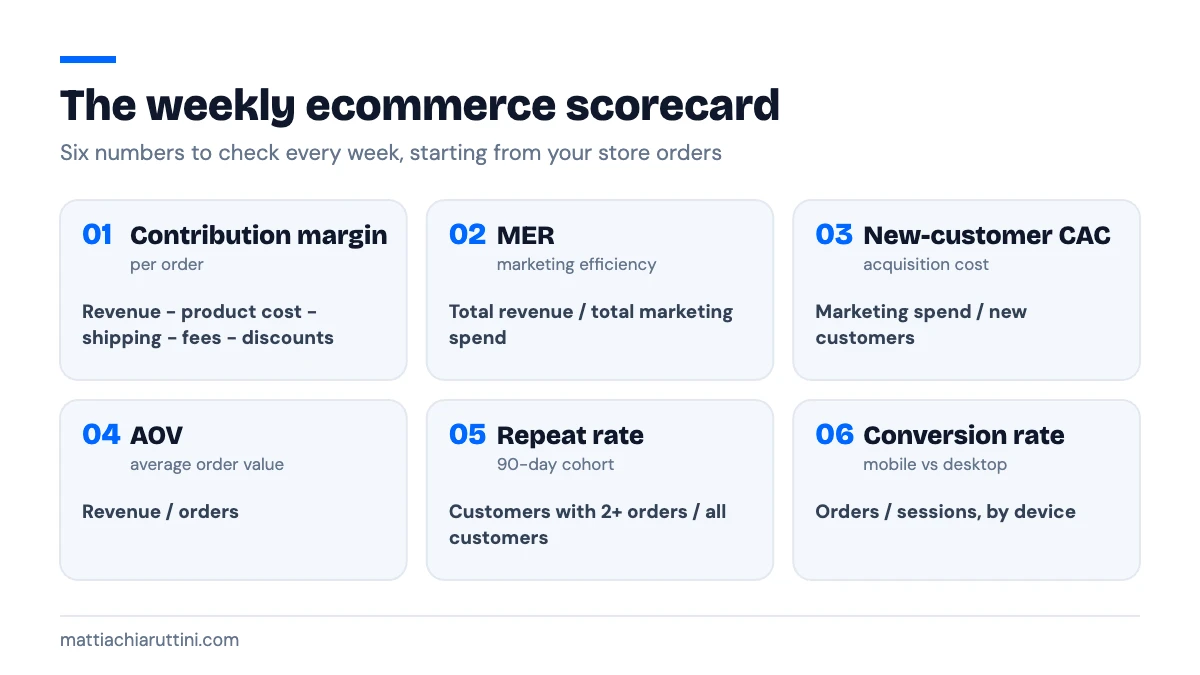
| Number | How to calculate it | What it tells you | How often |
|---|---|---|---|
| Contribution margin per order | Order revenue minus product cost, shipping, payment fees and discounts | How much each order really leaves you before ads | Weekly |
| MER | Total revenue ÷ total marketing spend | Whether marketing as a whole pays for itself | Weekly (daily in peak season) |
| New-customer CAC | Marketing spend ÷ new customers | What a brand-new customer costs you | Weekly |
| AOV | Revenue ÷ orders | Whether bundles and offers are working | Weekly |
| Repeat purchase rate | Customers with 2+ orders in 90 days ÷ all customers in the cohort | Whether people come back without paid ads | Monthly |
| Conversion rate by device | Orders ÷ sessions, mobile vs desktop | Whether the store is losing sales on the phone | Weekly |
Read them together, never alone. A rising CAC is fine if AOV and repeat purchases rise with it. A great MER is a warning sign if it comes from discounting your best customers.
The question I ask every week: if we doubled spend tomorrow, which of these six numbers would break first? That's where the work is.
How do you set up tracking you can trust?
You don't need a data team. You need a few things set up properly, once:
- Shopify (or your platform) as the source of truth for orders, revenue and new vs returning customers.
- Meta pixel plus Conversions API, with deduplication, so browsers blocking cookies don't make your sales disappear.
- Google Ads conversions with enhanced conversions turned on.
- GA4 with consistent UTM tags on every link you control: ads, emails, SMS, influencers.
- A post-purchase survey with one question: "How did you hear about us?". It catches word of mouth, podcasts and creators that no pixel sees.
- One sheet or dashboard with the six numbers, updated on the same day every week.
Start simple. A spreadsheet that's updated every Monday beats a beautiful dashboard nobody trusts.
How do you turn numbers into decisions?
Numbers are useless without rules. Write down, before you need them, what you'll do when each one moves. A few of mine:
| If this happens | Check first | Then |
|---|---|---|
| MER drops for 2 weeks | Did spend jump? Did AOV or conversion rate fall? | Roll back the last budget increase, fix the weaker number |
| New-customer CAC goes above first-order margin | Repeat purchase rate and 90-day LTV | If repeat is low, fix the offer or AOV before scaling |
| Mobile conversion rate falls behind desktop | Checkout speed, payment options, pop-ups | Fix the mobile checkout before buying more traffic |
| AOV drops | Discount depth, bundle visibility | Push bundles and free-shipping thresholds |
| A creative wins on platform ROAS but MER doesn't move | New vs returning buyers in that ad | It may be retargeting existing customers: cap it |
Change one thing at a time. If you change budget, offer and creative in the same week, the numbers will move and you won't know why.
What does this look like in practice?
When I started with BEEQ, a skincare brand with one product, in early 2023, there was a failed test with a previous agency behind us and a website to rebuild. Before spending, we tracked sessions, orders, AOV, conversion rate and acquisition cost. The first campaign ran at €30 a day in July 2023.
From there the rule was simple: test in flat months, push what worked in peak months, and use bundles, gift boxes and reviews to offset rising acquisition costs. BEEQ went from €6K in revenue in 2022 to €518K in 2025. The full story, with the numbers year by year, is in the BEEQ case study.
Which tools do you need (and when)?
| Tool | What it's for | When you need it |
|---|---|---|
| Shopify analytics | Orders, revenue, new vs returning, AOV | From day one |
| GA4 | Sessions, funnels, conversion rate by device and channel | From day one |
| A spreadsheet or Looker Studio | The weekly six-number scorecard | From day one |
| Klaviyo or your email platform | Cohorts, repeat purchases, predicted customer value | Once you have a few hundred customers |
| Triple Whale, Northbeam or Polar | Multi-channel attribution and blended reporting | When you spend meaningfully on several channels at once |
Expensive tools don't make you data-driven. Looking at the same numbers every week, and acting on them, does.
The most common data mistakes in ecommerce
- Adding up platform ROAS. The total will be bigger than your real revenue.
- Tracking everything. Sixty KPIs means nobody watches any of them.
- Judging creative after two days. Give a new ad enough spend and time to tell you something.
- Ignoring margin. Revenue growth with shrinking margin is a slower way to lose money.
- Changing everything at once. You lose the only thing data gives you: knowing why.
Recap: your data-driven checklist
- Six numbers in one weekly scorecard.
- Store orders as the source of truth.
- Conversions API, enhanced conversions, UTMs and a post-purchase survey live.
- Platform ROAS for comparing ads, MER for budget.
- Written rules for when each number moves.
- One change at a time.
Data-driven marketing for ecommerce: frequently asked questions
What is data-driven marketing in ecommerce?
It means deciding budget, offers and creative from a short list of numbers you trust, starting from your store's real orders, instead of from what each ad platform reports about itself.
Which metric matters most for a DTC brand?
There isn't a single one, but MER (total revenue divided by total marketing spend) checked against your contribution margin is the best starting point: it tells you whether marketing as a whole is paying for itself.
Is platform ROAS useless?
No. It's useful to compare campaigns and creative inside the same platform. It's a bad number for deciding your total budget, because each platform counts the same sale its own way.
Do I need an attribution tool like Triple Whale or Northbeam?
Not on day one. With a clean Shopify setup, Meta's Conversions API, Google Ads conversions and a post-purchase survey you can make good decisions. Attribution tools start paying off when you spend meaningfully on several channels at once.
How often should I look at the numbers?
Spend and orders daily during launches and peak season, the full scorecard weekly, and cohorts (repeat purchase, LTV) monthly.
Can a small brand be data-driven?
Yes, and it should. BEEQ started with €30 a day in July 2023 and one product. What mattered was tracking sessions, orders, AOV, conversion rate and acquisition cost before spending more.
Let's talk about your store
A 30-minute call to understand where you are, where you want to go and whether I can help. If I'm not the right fit, I'll tell you straight away.